以前、こちらのBlogでGoogle ChartsからGoogle Sheetsにアップロードしたデータを参照する手順を記載した際、誰でもデータを参照できるようにしてデータにアクセスする手順を記載しました。
Google Chartsのドキュメントには、こちらに記載されているように認証を利用してGoogle Sheetsを参照する方法が記載されており、少し気になったため試してみました。
試したのはExample: Using OAuth to access /gviz/tqに記載されていた方法です。
まず、下記の手順にしたがい、OAuth client IDを準備しました。
1. From the developer console, create a new OAuth client ID.
2. Choose Web application as your application type.
3. Pick any name; it is for your information only.
4. Add the name of your domain (and any test domains) as Authorized JavaScript Origins.
5. Leave Authorized redirect URIs blank.
次に、Example: Using OAuth to access /gviz/tqに記載されていたサンプルコードを参考にして、下記のようなJavaScriptを用意しました。Google Sheets側で特に共有設定をしていないデータを参照してグラフをプロットすることができました。
下記のコードのclientIdとmakeApiCall関数内の変数tqUrlに渡すGoogle Sheetsのアドレス(/gviz/tqの前の部分)には、それぞれの環境で取得した値をセットします。
<button id="authorize-button" style="visibility: hidden">Authorize</button>
<script type="text/javascript" src="https://www.gstatic.com/charts/loader.js"></script>
<script type="text/javascript">
google.charts.load('current', {packages:['corechart']});

const clientId = '111111111111-0123456789abcdefghij01234klmnopq.apps.googleusercontent.com';
const scopes = 'https://www.googleapis.com/auth/spreadsheets';


function init() {
    gapi.auth.authorize(
        {client_id: clientId, scope: scopes, immediate: true},
        handleAuthResult);
}


function handleAuthResult(authResult) {
    const authorizeButton = document.getElementById('authorize-button');
    if (authResult && !authResult.error) {
        authorizeButton.style.visibility = 'hidden';
        makeApiCall();
    } else {
        authorizeButton.style.visibility = '';
        authorizeButton.onclick = handleAuthClick;
    }
}


function handleAuthClick(event) {
    gapi.auth.authorize(
        {client_id: clientId, scope: scopes, immediate: false},
        handleAuthResult);
    return false;
}


function makeApiCall() {
    const tqUrl = 'https://docs.google.com/spreadsheets/d/1ZBELqu5CuNJJJBe6Ho9wJFyW4bv2F-VDKrz_LCwZRi4/gviz/tq'
        + '?access_token=' + encodeURIComponent(gapi.auth.getToken().access_token);
    const query = new google.visualization.Query(tqUrl);
    query.send(drawChart);
}

const skip_length = 1;
const time_interval = 0.01;

function drawChart(response) {
    const data = response.getDataTable();
    const numRows = data.getNumberOfRows();
    const numThinnedRows = Math.floor(numRows / skip_length);
    const remainder = numRows % skip_length;

    for (let rowIndex = 0; rowIndex < numThinnedRows; rowIndex++) {
        data.removeRows(rowIndex, skip_length - 1);
    }

    if (remainder != 0) {
        data.removeRows(numThinnedRows, remainder);
    }

    // data thinning
    const options = {title: 'phyphox 3-axis acceleration sensor data (after data thinning)',
                     hAxis: {title: 'time[s]'},
                     vAxis: {title: 'acceleration [m/s^2]'}};
    const chart = new google.visualization.LineChart(document.getElementById('after_data_thinning'));
    chart.draw(data, options);
    // ...
}

</script>
<script src="https://apis.google.com/js/auth.js?onload=init"></script>
Google Cloud Platformの「OAuth 同意画面」で公開ステータスが「テスト」のウェブアプリを用意し、テストユーザーを一人追加して確認しました。(設定の中でGoogle Sheetsのデータを参照するドメイン名を入力しています。)
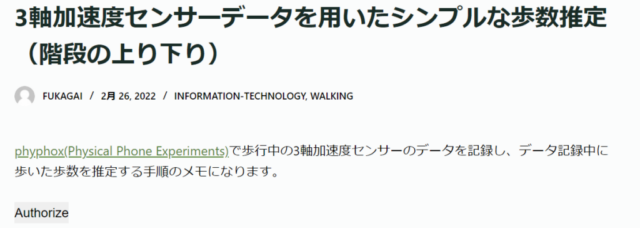
上記のコードを用意すると、下の図のように「Authorize」と書かれたボタンが表示されます。
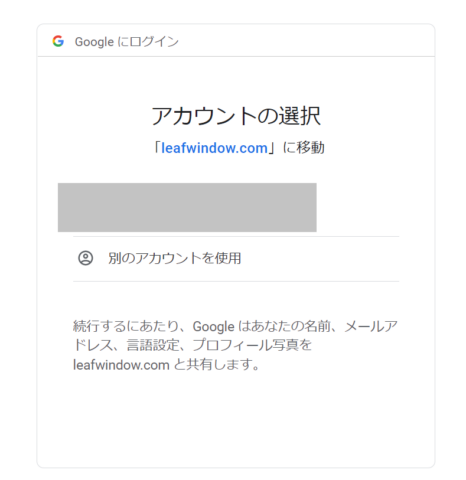
Chromeで「Authorize」をクリックすると下の図のようなウィンドウが表示されます。
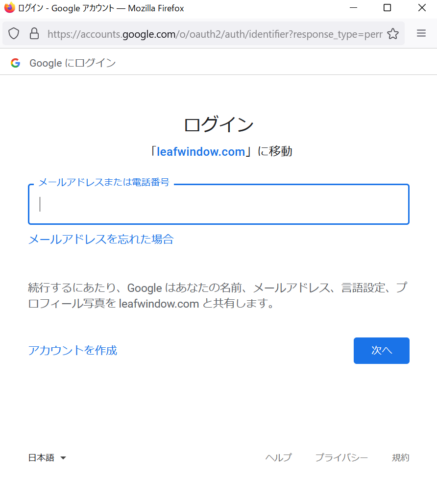
下の図はFireFoxで「Authorize」をクリックしたときに表示されるウィンドウです。
追加したテストユーザーのメールアドレスを入力し、必要に応じてパスワードを入力するとグラフが表示されるようになります。上記のコードの例の場合、下記のhtmlを記載した箇所にグラフが表示されます。
<div id="after_data_thinning" style="width: 100%; height: 500px;"></div>
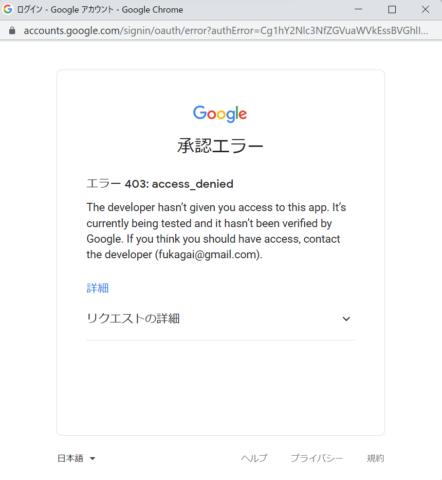
入力したメールアドレスが追加したテストユーザーのメールアドレスでなかった場合、下の図のようなウィンドウが表示され、グラフは表示されません。(追加したテストユーザーのメールアドレスを入力してもパスワードが間違っているとグラフは表示されません。)


